Innovation

competitive markets drive long-term
Emissions
Reduction
Economic dispatch encourages competition to produce more efficient generation resources. As the resource-neutral operator of a reliable, economical grid, PJM favors no resource technology.
To serve the growing interests of policymakers, regulators and stakeholders in 2022, PJM published the annual emission rates measured in pounds per megawatt-hour during 2021. The PJM system average annual value is a weighted average accounting for higher loads in summer and winter.
Long-term trends show continuing emission rate declines:
lbs/MWh SO2 and NOx
lbs/MWh

visualizing data at pjm.com
Marginal
Emissions

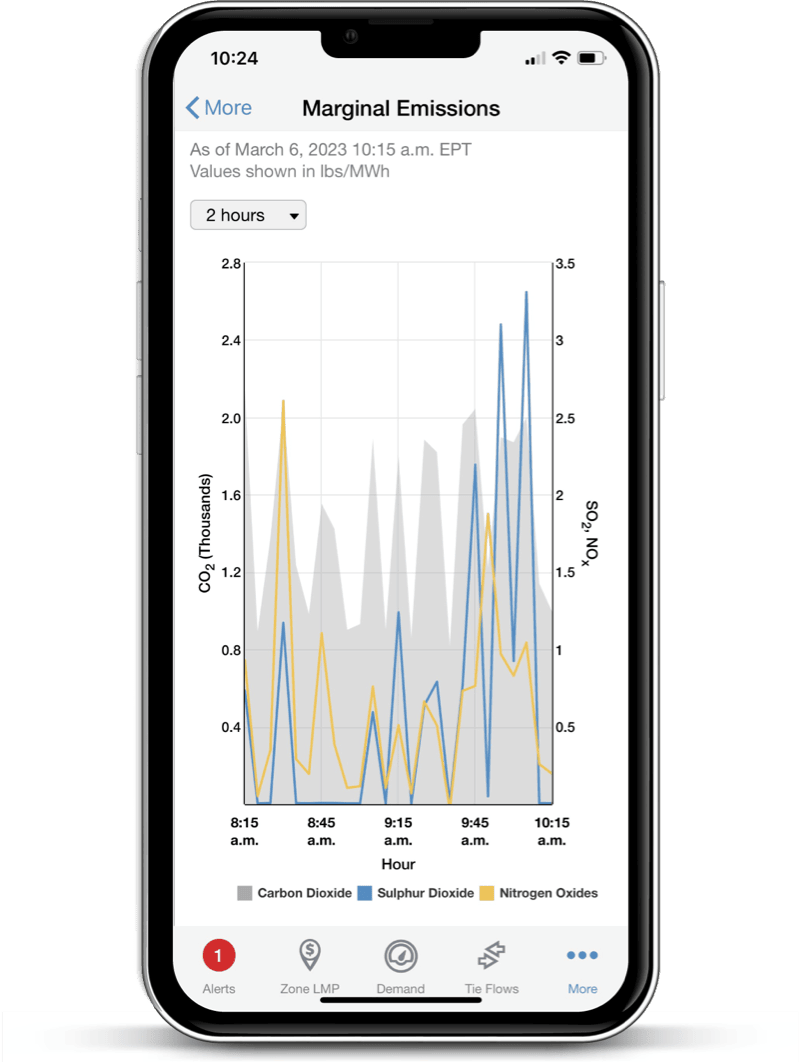
A new page launched on PJM.com illustrates marginal emissions information for the region PJM serves.
The new emissions page and marginal emissions graph reflect the marginal emission rates of carbon dioxide (CO2), nitrogen oxides (NOx) and sulfur dioxide (SO2).
Marginal emissions are the emissions caused by producing the last megawatt of energy on the system serving customer load.
Any variations in the way the system is dispatched to maintain grid reliability may change the type of electricity resource serving this “last megawatt,” which in turn would change the marginal emissions accordingly.
The new graph can display marginal emissions data for the PJM footprint in two-, four-, eight- and 12-hour increments, pulling information from PJM’s Data Miner tool.
The information is based on annually reported average data from electric generators within the PJM region. PJM does not receive real-time emissions data from plants.

Dynamic
line rating
Implementation
Beginning in the fall of 2022, a PPL Electric Utilities (PPL) project began streaming dynamic line rating data from three transmission lines in northeastern Pennsylvania to inform PJM functions.

Innovation

Competitive markets drive long-term
Emissions Reduction
Economic dispatch encourages competition to produce more efficient generation resources. As the resource-neutral operator of a reliable, economical grid, PJM favors no resource technology.
To serve the growing interests of policymakers, regulators and stakeholders in 2022, PJM published the annual emission rates measured in pounds per megawatt-hour during 2021. The PJM system average annual value is a weighted average accounting for higher loads in summer and winter.
Emissions data helps interested parties
Emissions increased in 2021 as energy use rebounded compared to decreases
Long term trends show continuing emission rate declines:
lbs/MWh SO2 and NOx
lbs/MWh


Visualizing data at PJM.com
Marginal
Emissions
A new page launched on PJM.com illustrates marginal emissions information for the region PJM serves.
The new emissions page and marginal emissions graph reflect the marginal emission rates of carbon dioxide (CO2), nitrogen oxides (NOx) and sulfur dioxide (SO2).
- Marginal emissions are the emissions caused by producing the last megawatt of energy on the system serving customer load.
- Any variations in the way the system is dispatched to maintain grid reliability may change the type of electricity resource serving this “last megawatt,” which in turn would change the marginal emissions accordingly.
- The new graph can display marginal emissions data for the PJM footprint in two-, four-, eight- and 12-hour increments, pulling information from PJM’s Data Miner tool.
- The information is based on annually reported average data from electric generators within the PJM region. PJM does not receive real-time emissions data from plants.

DYNAMIC
LINE Rating
Implementation
Beginning in the fall of 2022, a PPL Electric Utilities (PPL) project began streaming dynamic line rating data from three transmission lines in northeastern Pennsylvania to inform PJM functions.
were integrated into PJM reliability and markets processes for the three 230 kV circuits.
PPL installed technology on the three historically congested lines to communicate the impact to capacity caused by
As directed by FERC, PJM and its stakeholders established systems and procedures to accommodate
by transmission owners
In support of implementation by other transimission owners, this work continues in PJM's new
installed in september 2022.


